Eclipse and JFreeChart
Today I downloaded the latest Eclipse (Oxygen 3A) release because a customer is asking about getting started with JFreeChart and Eclipse, and the existing instructions for that are a bit out of date. Here are some new instructions for getting started.
Start Eclipse, then select New -> Project... from the File menu. Under the Wizards selection, choose Maven Project, then click the Next button.
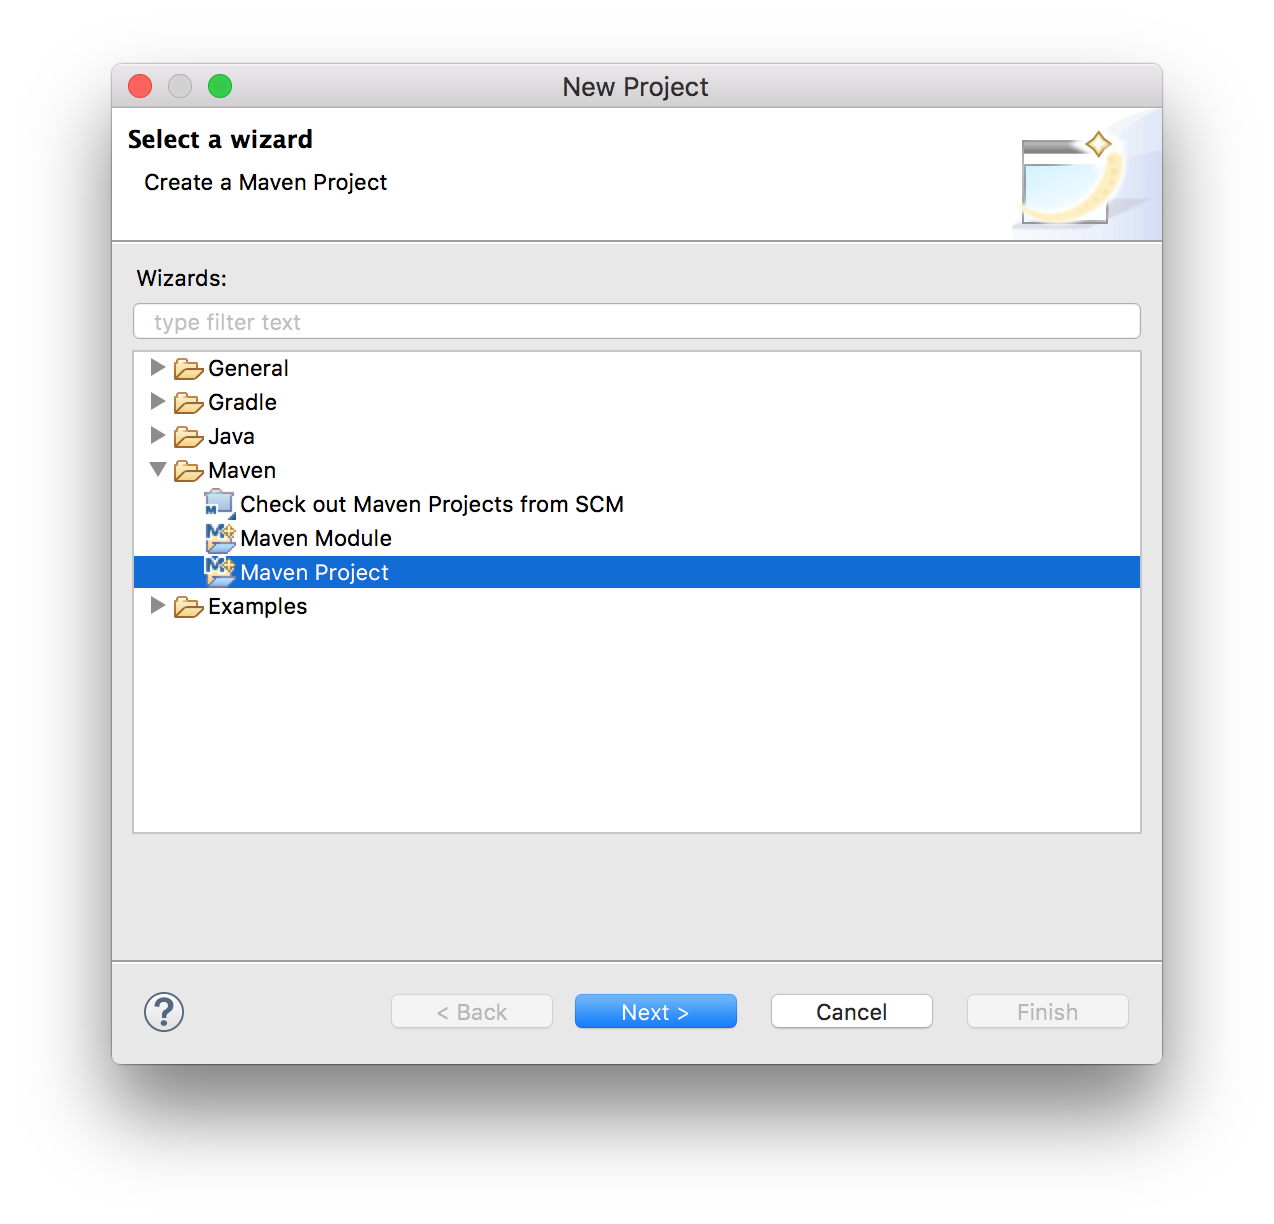 When the
 New Maven Project dialog appears, select the ‘Create a simple project’ checkbox, then click the Next button.
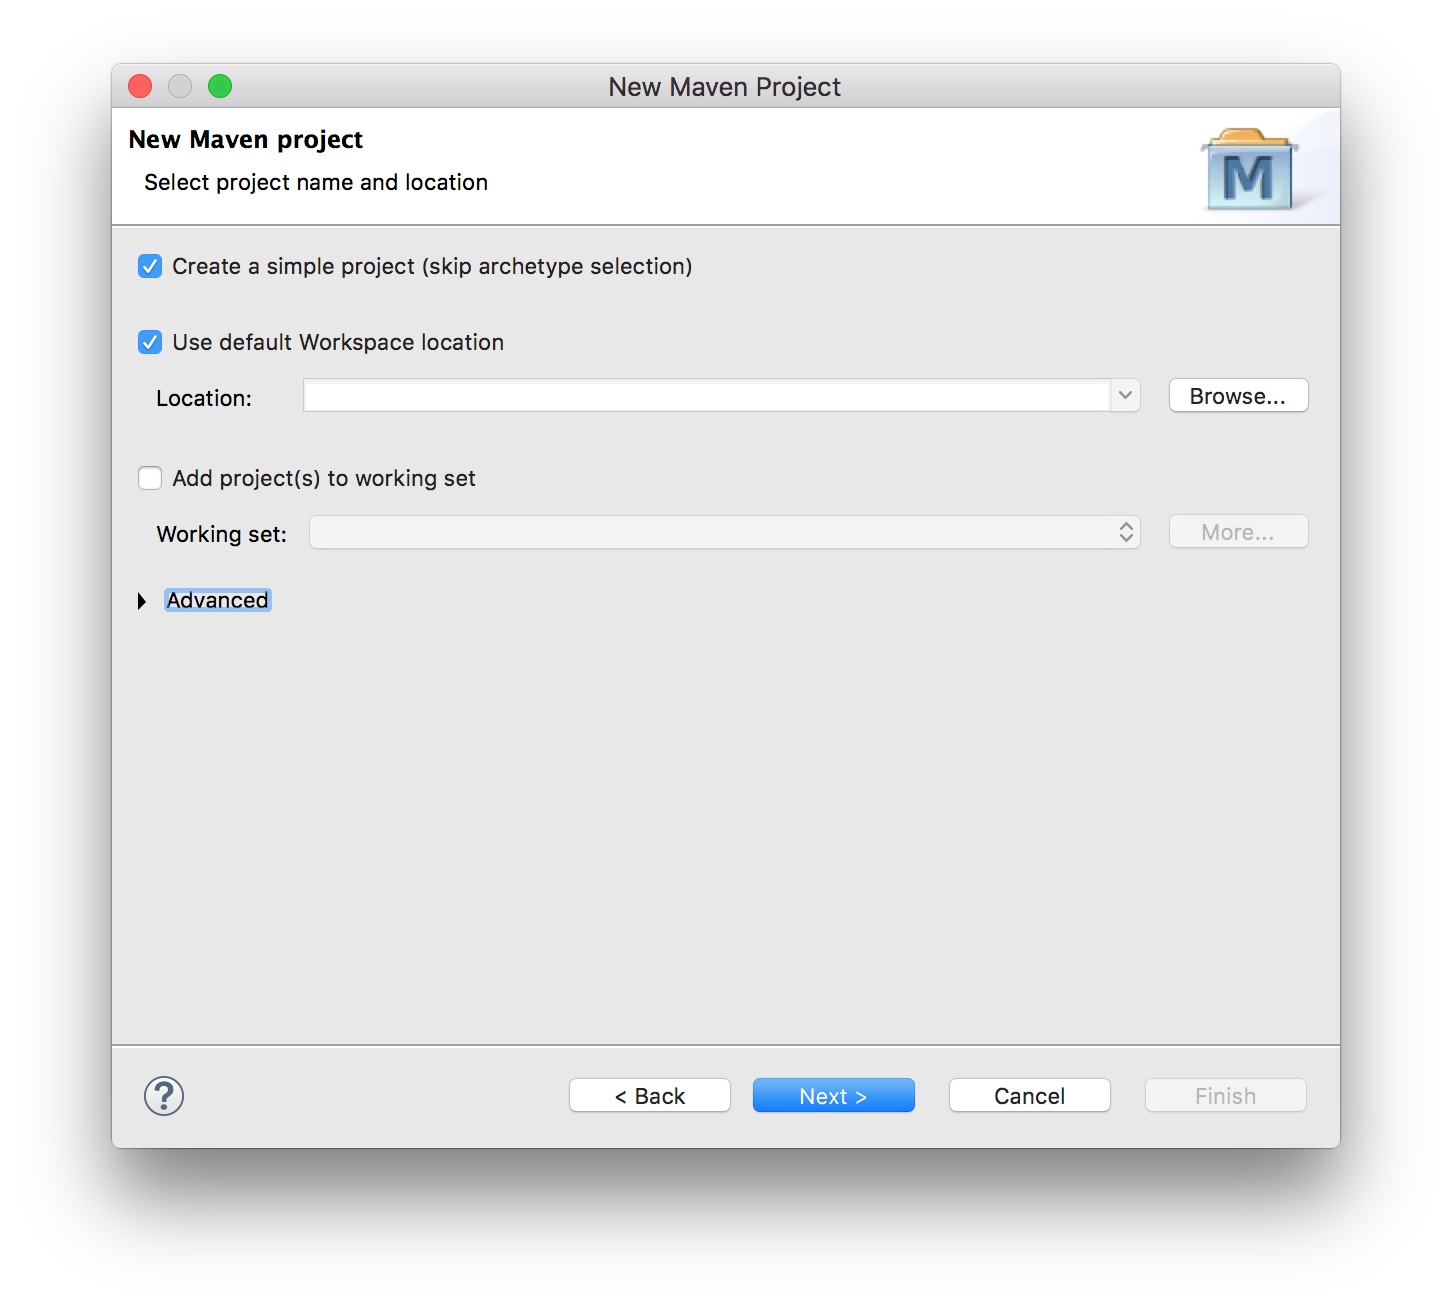 At the next step, fill in the details that will be used to set up the initial
 pom.xml file that will be used by Maven to build your application (you can change the details later), then click the Finish button.
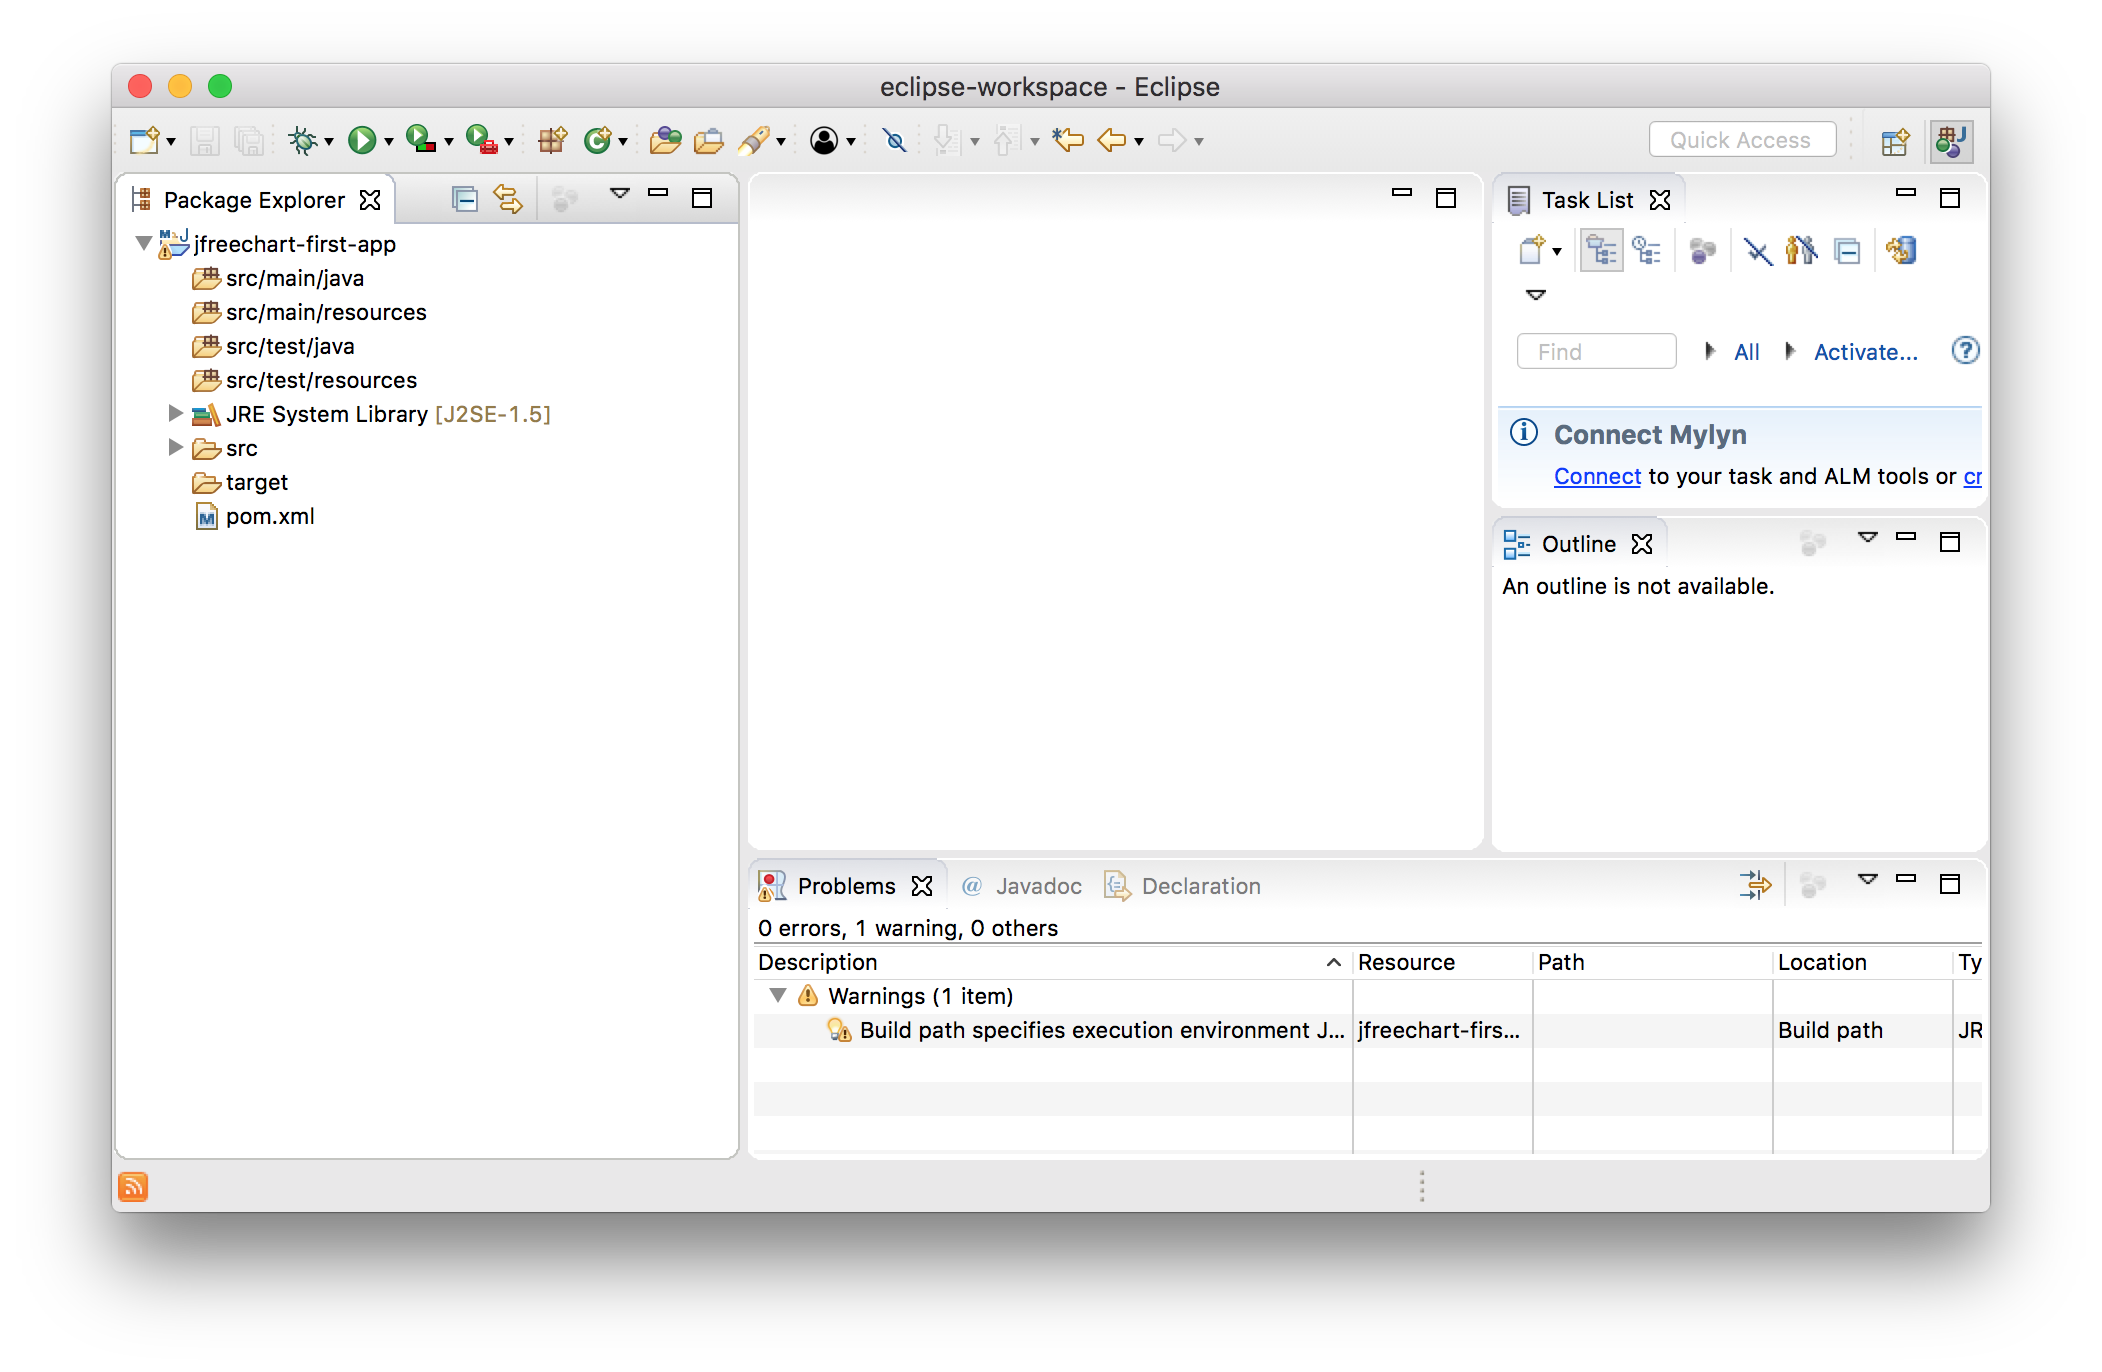
At this point you will have a skeleton project that looks like this:
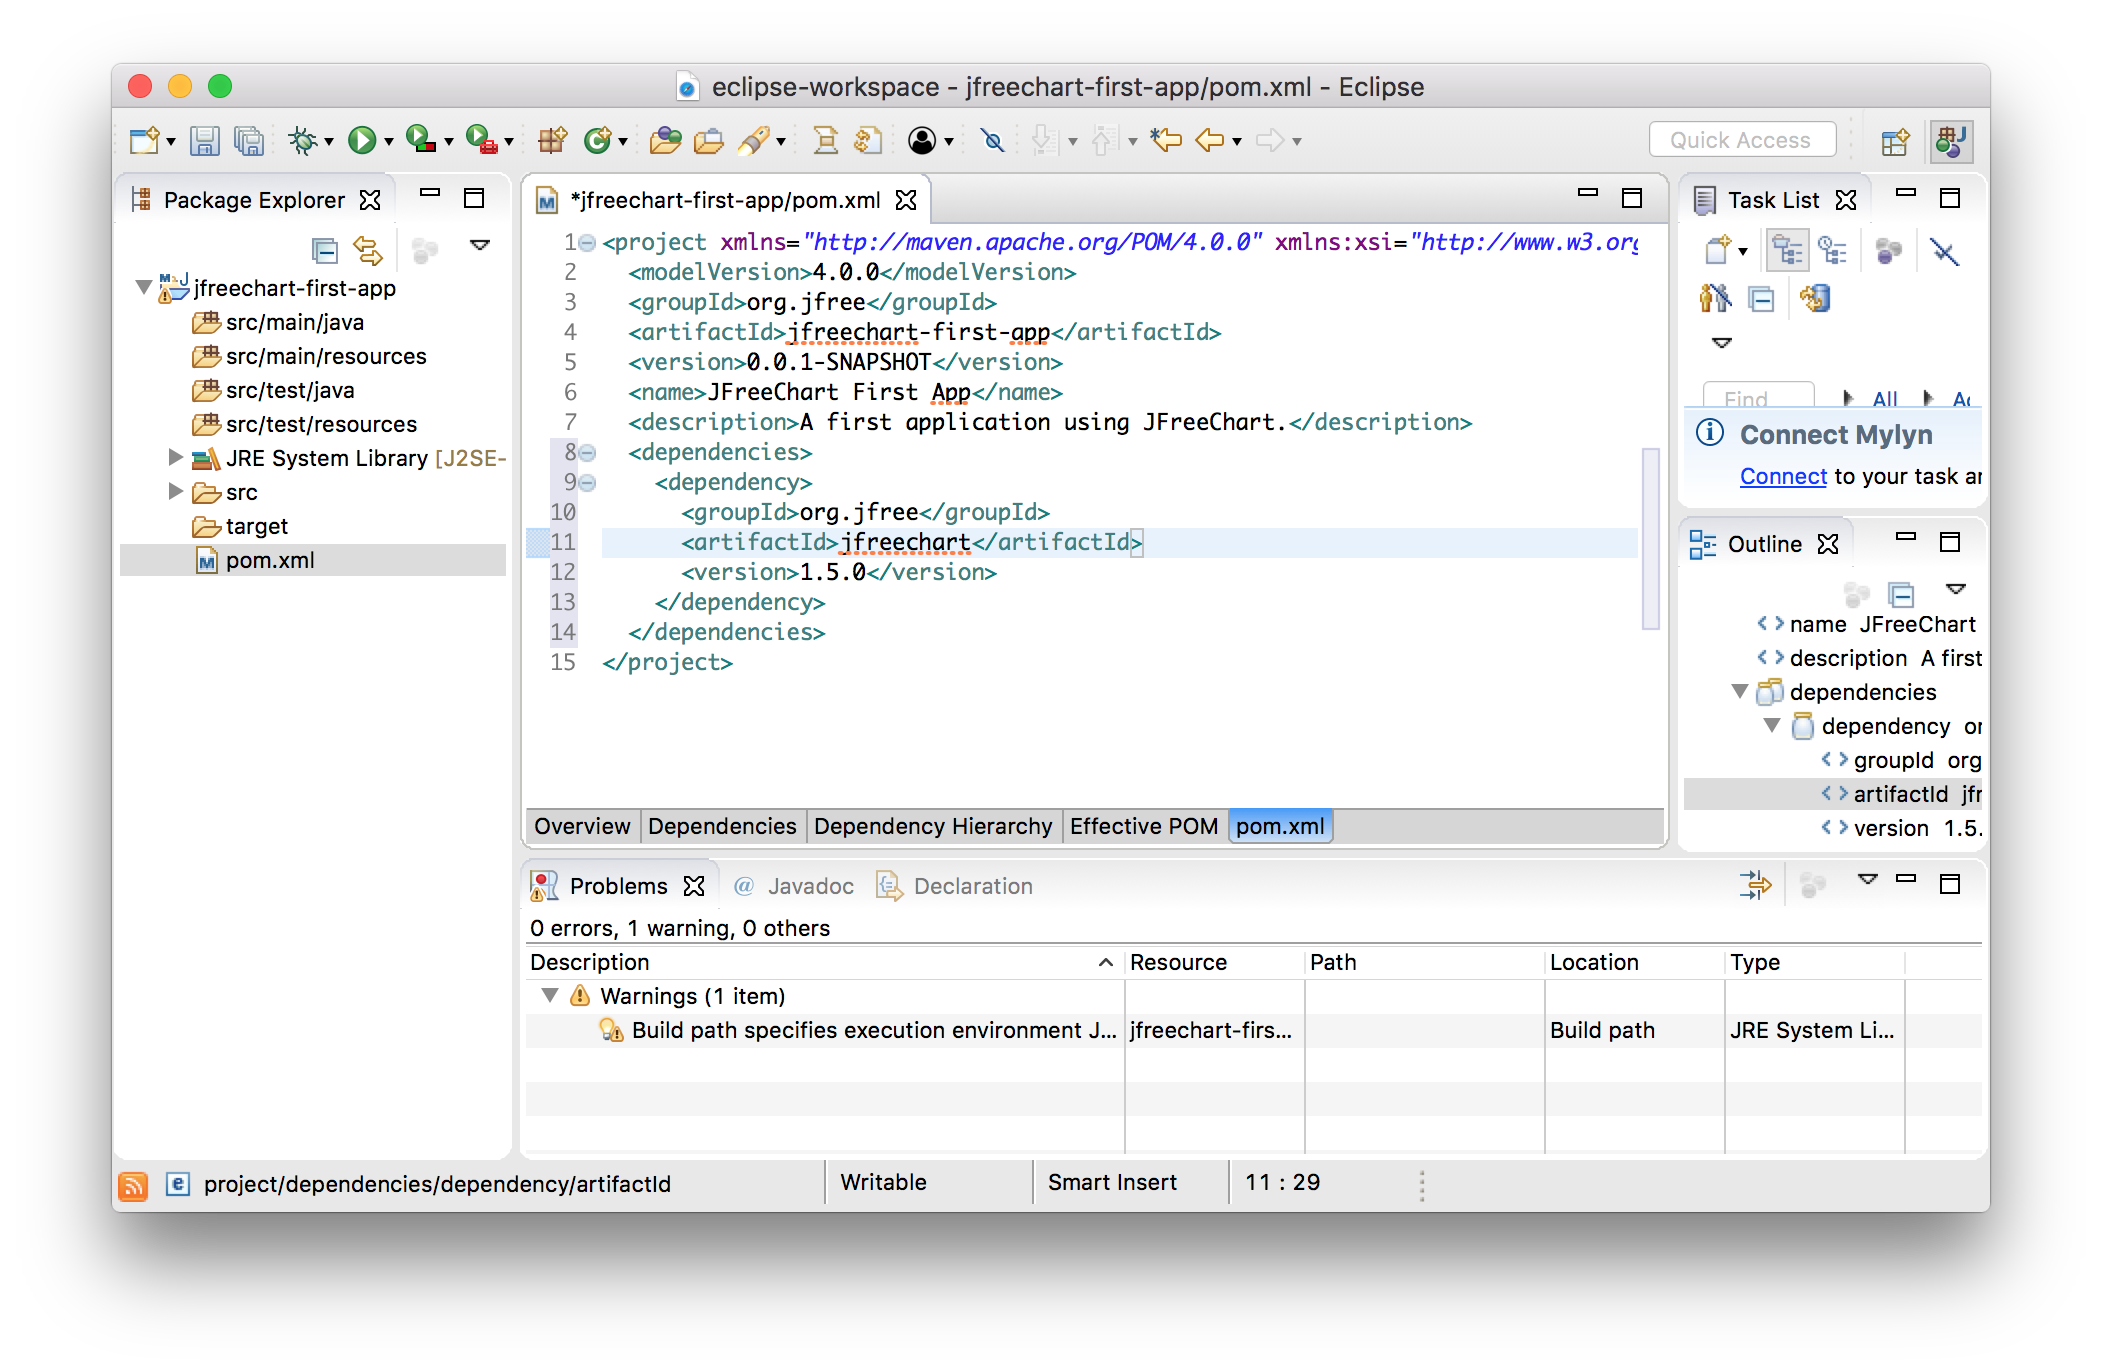
 Now you need to edit the
 pom.xml to include a dependency for JFreeChart 1.5.0. Add the lines 8 - 14 shown in the screenshot below:
 Next, you need to add the code for a simple JFreeChart application. Right-click on
 src/main/java and select the New -> Class menu item. Type ‘First’ as the name of the class and then click the Finish button.
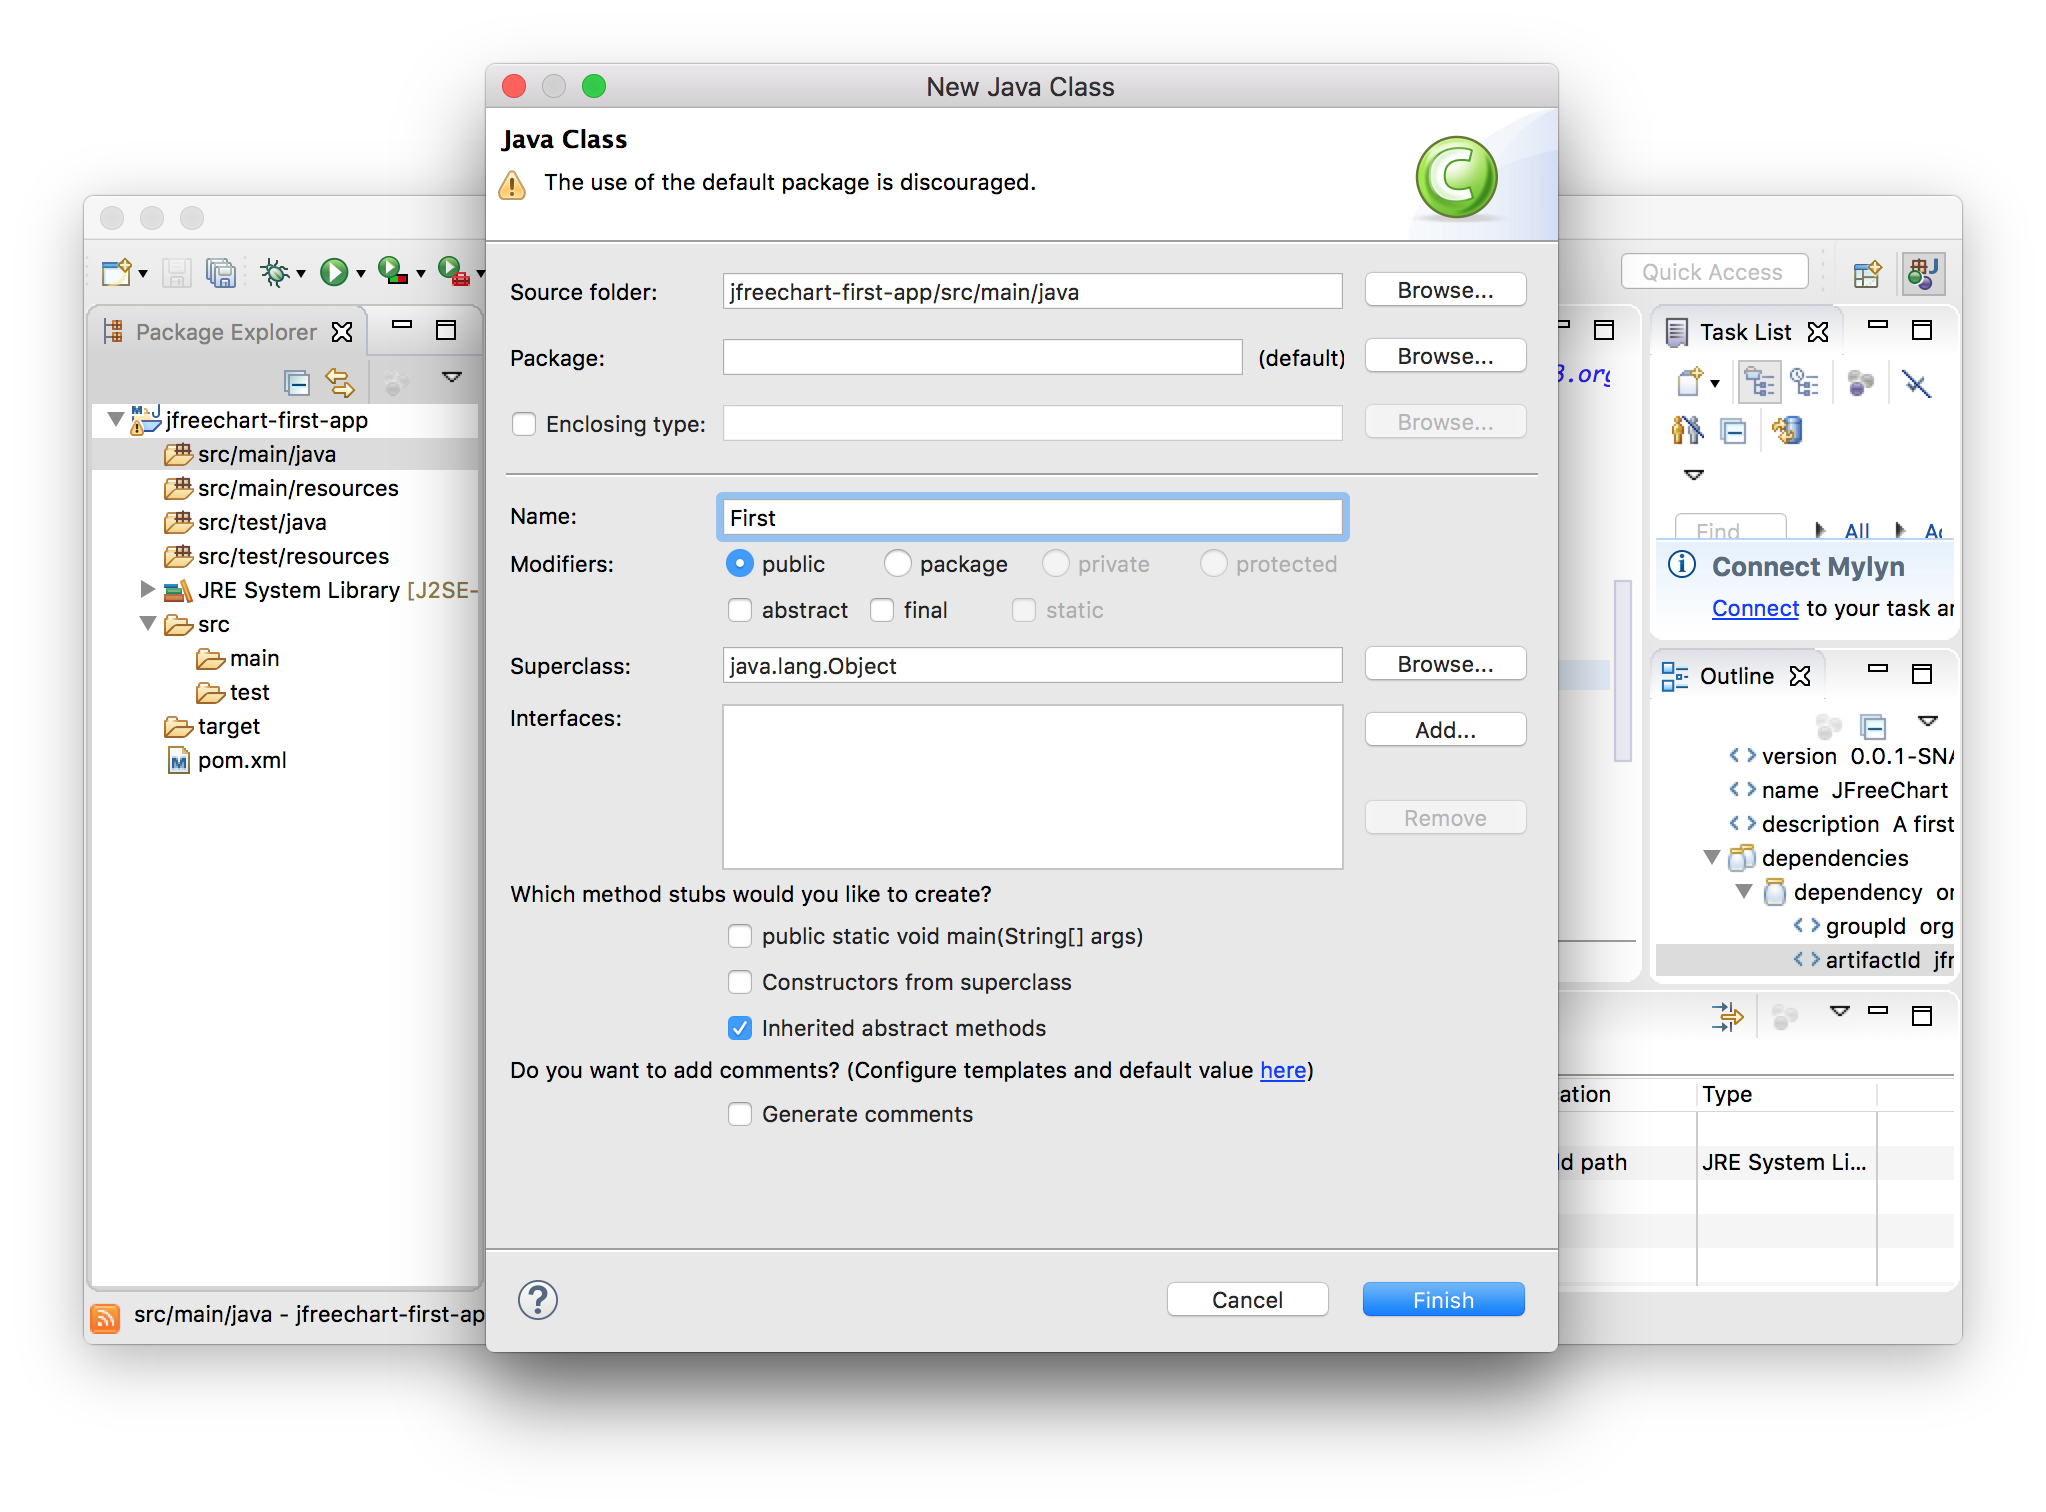
Next you should edit the First.java file to contain the following code:
import org.jfree.chart.ChartFactory;
import org.jfree.chart.ChartFrame;
import org.jfree.chart.JFreeChart;
import org.jfree.data.general.DefaultPieDataset;

/**
 * A simple introduction to using JFreeChart. This demo is described in the
 * JFreeChart Developer Guide.
 */
public class First {

    /**
     * The starting point for the demo.
     *
     * @param args ignored.
     */
    public static void main(String[] args) {
        // create a dataset...
        DefaultPieDataset data = new DefaultPieDataset();
        data.setValue("Category 1", 43.2);
        data.setValue("Category 2", 27.9);
        data.setValue("Category 3", 79.5);
        // create a chart...
        JFreeChart chart = ChartFactory.createPieChart(
            "Sample Pie Chart",
            data,
            true, // legend?
            true, // tooltips?
            false // URLs?
        );
        // create and display a frame...
        ChartFrame frame = new ChartFrame("First", chart);
        frame.pack();
        frame.setVisible(true);
    }
}
Now clicking the Run button in Eclipse will run the app and show you the following:
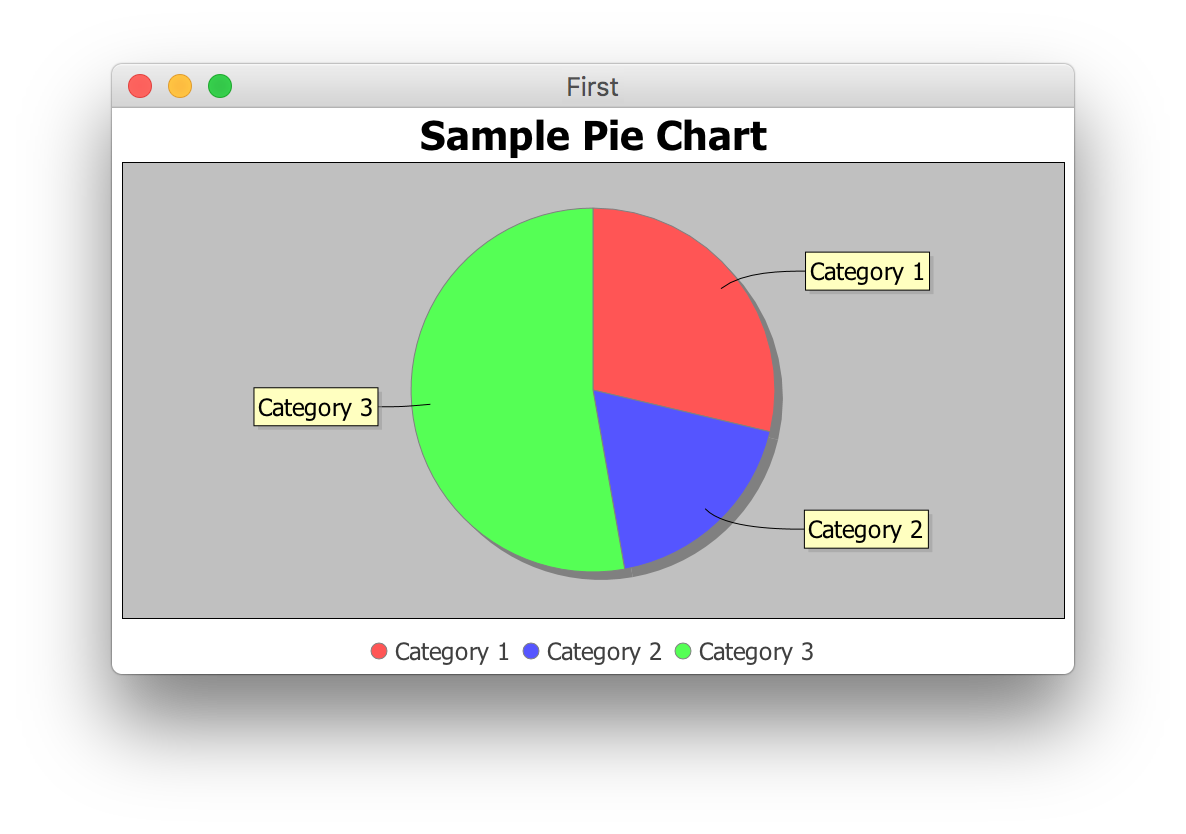
And it is as simple as that!